x
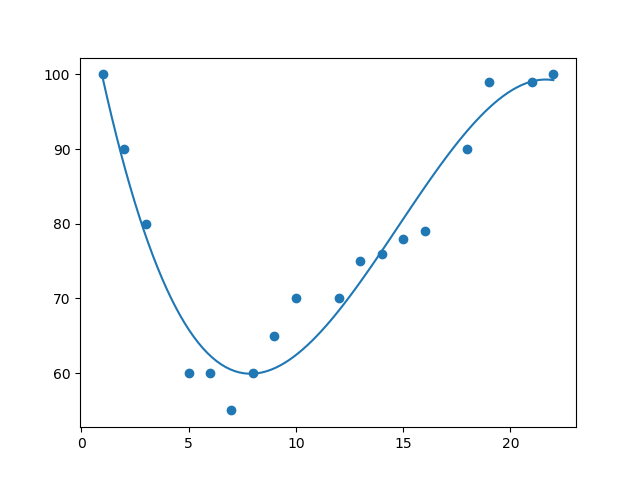
#Three lines to make our compiler able to draw:import sysimport matplotlibmatplotlib.use('Agg')import numpyimport matplotlib.pyplot as pltx = [1,2,3,5,6,7,8,9,10,12,13,14,15,16,18,19,21,22]y = [100,90,80,60,60,55,60,65,70,70,75,76,78,79,90,99,99,100]mymodel = numpy.poly1d(numpy.polyfit(x, y, 3))myline = numpy.linspace(1, 22, 100)plt.scatter(x, y)plt.plot(myline, mymodel(myline))plt.show()#Two lines to make our compiler able to draw:plt.savefig(sys.stdout.buffer)sys.stdout.flush()