x
#Three lines to make our compiler able to draw:import sysimport matplotlibmatplotlib.use('Agg')import pandas as pdimport matplotlib.pyplot as pltDrowning_Accident = [20,40,60,80,100,120,140,160,180,200]Ice_Cream_Sale = [20,40,60,80,100,120,140,160,180,200]Drowning = {"Drowning_Accident": [20,40,60,80,100,120,140,160,180,200],"Ice_Cream_Sale": [20,40,60,80,100,120,140,160,180,200]}Drowning = pd.DataFrame(data=Drowning)Drowning.plot(x="Ice_Cream_Sale", y="Drowning_Accident", kind="scatter")plt.show()correlation_beach = Drowning.corr()print(correlation_beach)#Two lines to make our compiler able to draw:plt.savefig(sys.stdout.buffer)sys.stdout.flush()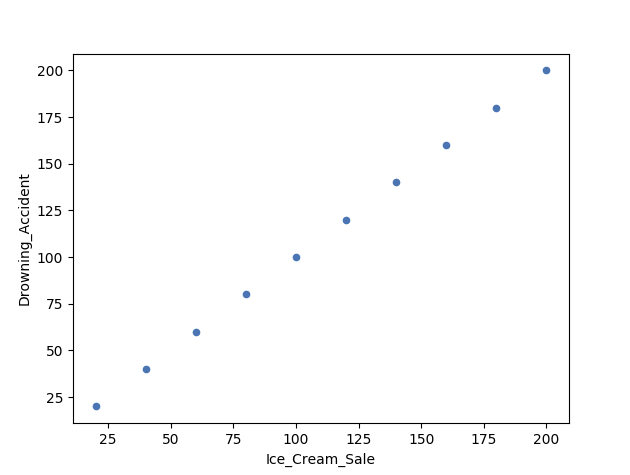
                   Drowning_Accident  Ice_Cream_Sale
Drowning_Accident                1.0             1.0
Ice_Cream_Sale                   1.0             1.0