x
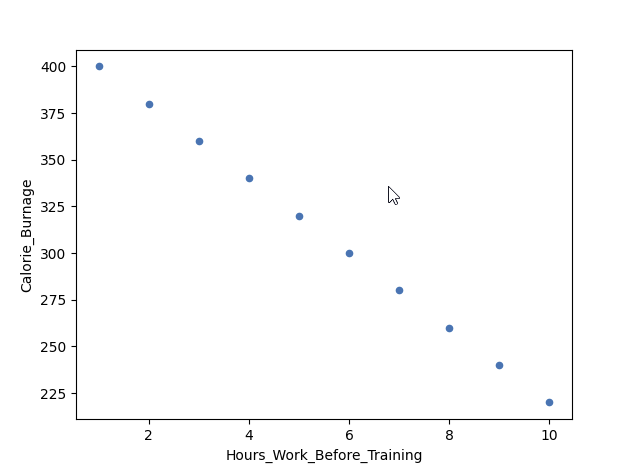
#Three lines to make our compiler able to draw:import sysimport matplotlibmatplotlib.use('Agg')import pandas as pdimport matplotlib.pyplot as pltnegative_corr = {'Hours_Work_Before_Training': [10,9,8,7,6,5,4,3,2,1],'Calorie_Burnage': [220,240,260,280,300,320,340,360,380,400]}negative_corr = pd.DataFrame(data=negative_corr)negative_corr.plot(x ='Hours_Work_Before_Training', y='Calorie_Burnage', kind='scatter')plt.show()#Two lines to make our compiler able to draw:plt.savefig(sys.stdout.buffer)sys.stdout.flush()