Run ❯
Get your
own Python
server
❯
Run Code
Ctrl+Alt+R
Change Orientation
Ctrl+Alt+O
Change Theme
Ctrl+Alt+D
Go to Spaces
Ctrl+Alt+P
prog.py
data.csv
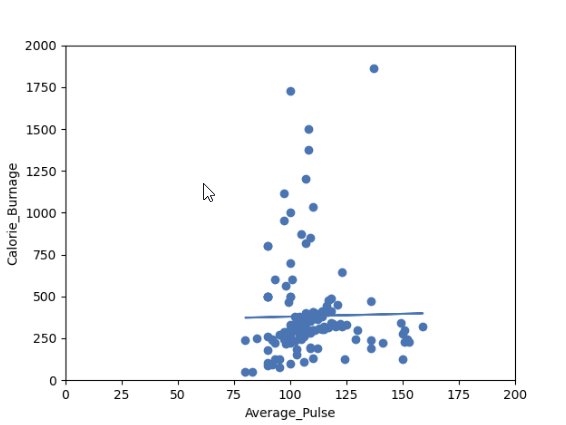
#Three lines to make our compiler able to draw: import sys import matplotlib matplotlib.use('Agg') import pandas as pd import matplotlib.pyplot as plt from scipy import stats full_health_data = pd.read_csv("data.csv", header=0, sep=",") x = full_health_data["Average_Pulse"] y = full_health_data["Calorie_Burnage"] slope, intercept, r, p, std_err = stats.linregress(x, y) def myfunc(x): return slope * x + intercept mymodel = list(map(myfunc, x)) plt.scatter(x, y) plt.plot(x, mymodel) plt.ylim(ymin=0, ymax=2000) plt.xlim(xmin=0, xmax=200) plt.xlabel("Average_Pulse") plt.ylabel ("Calorie_Burnage") plt.show() #Two lines to make our compiler able to draw: plt.savefig(sys.stdout.buffer) sys.stdout.flush()
Duration,Average_Pulse,Max_Pulse,Calorie_Burnage,Hours_Work,Hours_Sleep 60,110,130,409,0,8 60,117,145,479,0,8 60,103,135,340,8,7.5 45,109,175,282,8,8 45,117,148,406,0,6.5 60,102,127,300,0,7.5 60,110,136,374,0,7.5 45,104,134,253,0,9 30,109,133,195,8,8 60,98,124,269,7.5,8 60,103,147,329,8,7 60,100,120,250,0,5 60,106,128,345,8.5,7.5 60,104,132,379,8.5,7.5 60,98,123,275,9,7 60,98,120,215,6.5,7 60,100,120,300,9,8 45,90,112,180,8,8 60,103,123,323,8,8 45,97,125,243,8,7 60,108,131,364,8,7 45,100,119,282,0,7 60,130,101,300,8,7 45,105,132,246,0,8 60,102,126,334,8,8 60,100,120,250,8,7 60,92,118,241,7,6 60,103,132,353,9,8.5 60,100,132,280,3,8 60,102,129,380,3,8 60,92,115,243,7.5,8 60,101,124,299,8.5,7.5 60,93,113,223,8,7 60,107,136,361,2,8 60,114,140,415,9,8.5 60,100,120,300,8,7 60,100,120,300,7,6 45,104,129,266,8,7 60,98,126,286,7.5,7 60,100,122,329,8,7 60,111,138,400,8,8 60,111,131,397,0,8 60,99,119,273,8,7 60,109,153,387,8,7 45,111,136,300,11,7 45,108,129,298,5,7 60,111,139,397,0,8 60,107,136,380,8.5,8 80,123,146,643,8.5,8 60,106,130,263,8,8 60,118,151,486,7,7 30,136,175,238,0,7.5 60,121,146,450,5,8 60,118,121,413,8,7 45,115,144,305,5,7 20,153,172,226,0,8 45,123,152,321,5,8 210,108,160,1376,8,8 160,110,137,1034,8,8 160,109,135,853,8,8 45,118,141,341,8,8 20,110,130,131,0,8 180,90,130,800,0,8 150,105,135,873,8,8 150,107,130,816,3,8 20,106,136,110,3,8 300,108,143,1500,0,8 150,97,129,1115,0,8 90,100,127,700,0,8 150,97,127,953,0,8 45,114,146,304,0,8 90,98,125,563,0,8 45,105,134,251,0,8 45,110,141,300,7,7.5 120,100,130,500,7,7.5 270,100,131,1729,0,7 30,159,182,319,5,7.5 45,149,169,344,0,8 30,103,139,151,4,8 120,100,130,500,0,8 45,100,120,225,8.5,8 30,151,170,300,0,7 45,102,136,234,6.5,8 120,100,157,1000,0,8 45,129,103,242,5,8 20,83,107,50,9.5,8 180,101,127,600,0,7.5 45,107,137,1200,8,8 30,90,107,105,7,8 15,80,100,50,9,8 20,150,171,127,0,7.5 20,151,168,229,0,7 30,95,128,128,8,7.5 25,152,168,244,0,8 30,109,131,188,8,7.5 90,93,124,604,8,8 20,95,112,77,8,8 90,90,110,500,8,8 90,90,100,500,0,8 90,90,100,500,5,8 30,92,108,92,8,8 30,93,128,124,8,8 180,90,120,800,8,8 30,90,120,86,7,8 90,90,120,500,8,8 210,137,184,1860,0,7.5 60,102,124,325,0,8 45,107,124,275,0,8 15,124,139,124,5,6 60,108,131,367,0,8 60,108,151,351,0,8 60,116,141,443,0,8 60,97,122,277,0,8 60,105,125,353,0,8 60,103,124,332,0,8 30,112,137,193,0,8 45,100,120,100,0,7.5 60,119,169,336,0,8 60,107,127,344,0,8 60,111,151,368,0,8 60,98,122,271,0,8 60,97,124,275,0,8 60,109,127,382,0,6 90,99,125,466,0,7.5 60,114,151,384,0,12 60,104,134,342,0,7.5 60,107,138,357,0,7.5 60,103,133,335,0,7.5 60,106,132,327,0,7.5 60,103,136,339,0,7.5 20,136,156,189,8.5,7.5 45,117,143,317,0,8 45,115,137,318,0,7.5 45,113,138,308,0,7 20,141,162,222,0,7.5 60,108,135,390,0,8 60,97,127,288,0,8 45,100,120,250,0,8 45,122,149,335,0,7.5 60,136,170,470,8,8 45,106,126,270,8,8 60,107,136,400,9.5,7 60,112,146,361,9,7.5 30,103,127,185,9,7.5 60,110,150,409,8,7 60,106,134,343,8,8.5 60,109,129,353,8,8 60,109,138,374,8,6 30,150,167,275,0,9 60,105,128,328,9,8 60,97,131,270,9,8 60,100,120,270,8,8 60,114,150,382,0,8 30,80,120,240,10,7 30,85,120,250,10,7 45,90,130,260,8,7 45,95,130,270,8,7 45,100,140,280,0,7 60,105,140,290,7,8 60,110,145,300,7,8 60,115,145,310,8,8 75,120,150,320,0,8 75,125,150,330,8,8